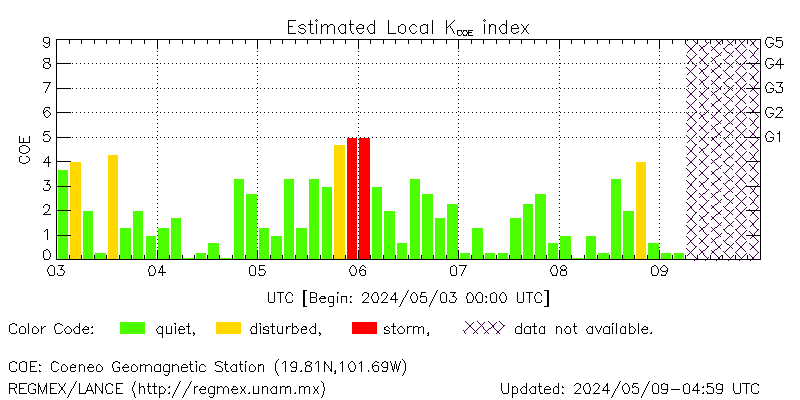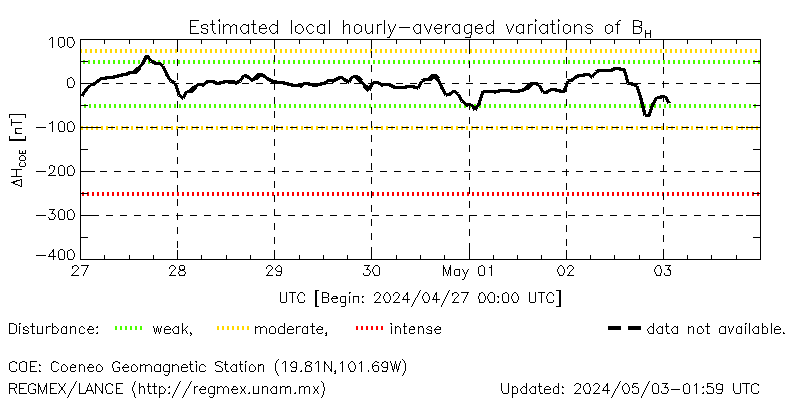


Las observaciones en Tiempo Real del Clima Espacial incluyen datos de la red de instrumentos de la Universidad Nacional Autónoma de México y de observatorios internacionales con acceso público.

Datos de Centelleo interplanetario. Cortesia del Mexican Array Telescope MEXART.


Las imágenes del satélite Solar Dynamics Observatory muestran en Tiempo Real las condiciones de la Fotosfera (amarillo), la Cromosfera (rojo) y la parte baja de la Corona (verde). Cortesia de NASA/SDO y el equipo científico de AIA, EVE y HMI.

El flujo de rayos X del Sol entre 1 - 8 angstroms (linea roja) es una medida de la actividad solar. Los picos representan fulguraciones solares de diferentes clases. Los eventos de clase M y X son los que más afectan al Clima Espacial. Cortesia del NOAA/NWS.

El flujo de Protones muestra la cantidad de partículas que están pasando cerca de la Tierra e indican la llegada de una Eyección de Masa Coronal (EMC) a nuestro vecindario terrestre. Cortesia del NOAA/NWS.
El índice Dst muestra las variaciones del campo magnético terrestre y es un indicativo de las tormentas geomagnéticas que pueden afectar las radiocomunicaciones. Cortesia de Kyoto Dst index service.
Los mapas de Contenido Electrónico Total (TEC) son producidos en tiempo real cada 5 minutos utilizando GPSs. La variación del TEC nos indica perturbaciones en la ionosfera que pueden afectar las radiocomunicaciones. Cortesia de NASA/JPL-Caltech